
站内搜索
Oracle证书


分类目录
- ASM (30)
- Database (86)
- backup&recovery (21)
- expdp/impdp (5)
- Installation and Deinstall (31)
- network (7)
- ORA-600 or ORA-7445 (6)
- Performence Tuning (13)
- troubleshoooting (2)
- Dataguard (7)
- EBS (3)
- Exadata (120)
- FAQ (19)
- POC和性能调整 (11)
- 体系架构 (19)
- 内部机制 (22)
- 安装和升级 (14)
- 性能指标 (8)
- Exadata V1 (1)
- Exadata V2 (1)
- Exadata X2-2 (2)
- Exadata X3-2 (1)
- Exadata X4-2 (1)
- FAQ (1)
- 故障诊断 (3)
- 日常运维 (15)
- 硬件配置 (43)
- Exadata V1 (6)
- Exadata V2 (6)
- Exadata X2-2 (6)
- Exadata X3-2 (8)
- Exadata X4-2 (8)
- FAQ (1)
- FAQ (16)
- Internal (21)
- Linux (20)
- MYSQL (8)
- OGG (1)
- ORA-600/7445 (2)
- ORA-XXXXX (5)
- Oracle 11.1 & Oracle11.2 (6)
- ORACLE 12C (21)
- Oracle 8 & Oracle 8i (1)
- RAC (47)
- SAP (2)
- Scripts (6)
- 未分类 (1)
- 虚拟化 (1)
2026 年五月 S M T W T F S « Nov 1 2 3 4 5 6 7 8 9 10 11 12 13 14 15 16 17 18 19 20 21 22 23 24 25 26 27 28 29 30 31 文章归档
-
近期文章
- 针对最近黑客攻击数据库的解决方案和预防建议
- CentOS7.2(RHEL 7.2)的CPU占用高(%system 占用高)
- Oracle 12.1 RAC 系列 – 配置第二个网络和相应的SCAN2
- Oracle 12.1 RAC 系列-安装新主机,识别老存储和恢复数据库
- Oracle 12.2的Sharding-1-基础概念
- 11.2 RAC 系列-安装新主机,识别老存储-3-配置老存储的数据库
- 11.2 RAC 系列-安装新主机,识别老存储-2-准备识别数据库
- 11.2 RAC 系列-安装新主机,识别老存储-1-识别ASM磁盘
- 2016年1月PSU列表
- 单实例数据库转换为RAC数据库–使用rconfig转换
近期评论
- tom 发表在《exadata巡检报告的模板》
- cyx 发表在《关于我》
- 李科胜 发表在《EBS克隆–db和app分开在两个服务器上》
- xiao 发表在《exadata巡检报告的模板》
- Chris Sun 发表在《使用Oracle 11.2的DBMS_RESOURCE_MANAGER.CALIBRATE_IO对Exadata X5(HC)进行测试》
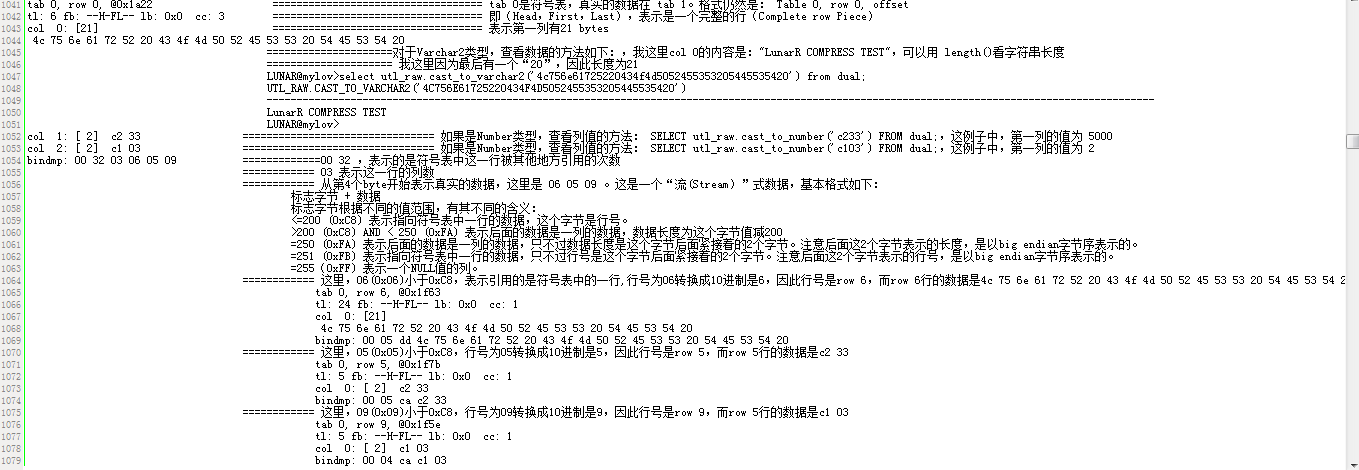
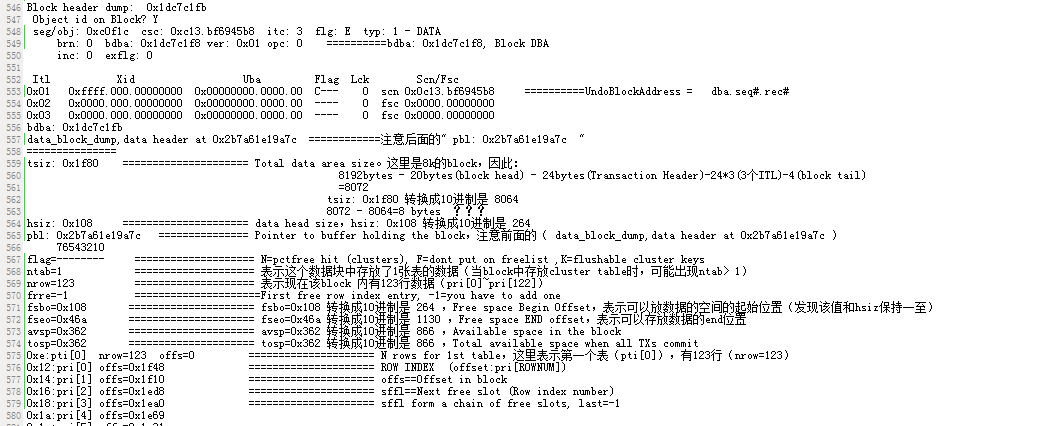
Exadata上HCC表的数据块结构—3-HCC块(compress for query low)
关于EHCC表的测试参见:
Exadata上的HCC测试(EHCC)——1
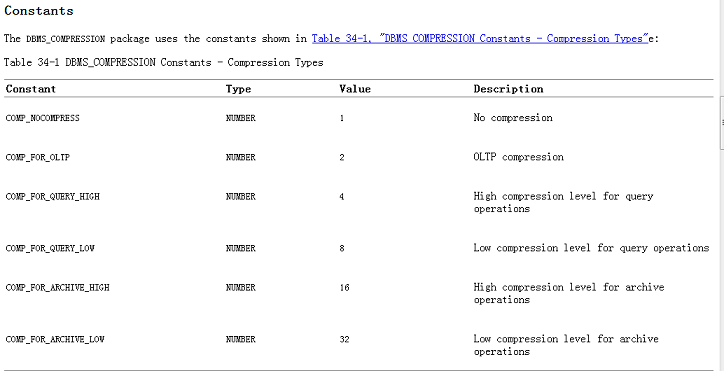
Exadata上的HCC测试(EHCC)—2—:DBMS_COMPRESSION.GET_COMPRESSION_RATIO
Exadata上的HCC测试(EHCC)—3—分区表的压缩
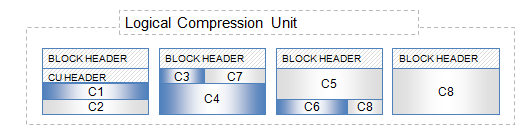
HCC(Hybrid Columnar Compression )是数据以CU(compression units )的方式存储,一个CU是由一组连续的block组成的,比如常见的是32k(即,4个连续的8k的block)。每个CU内部都是按列存储的数据,每一列都分别进行压缩,但是每一行数据都可以在一个CU内完全找到。
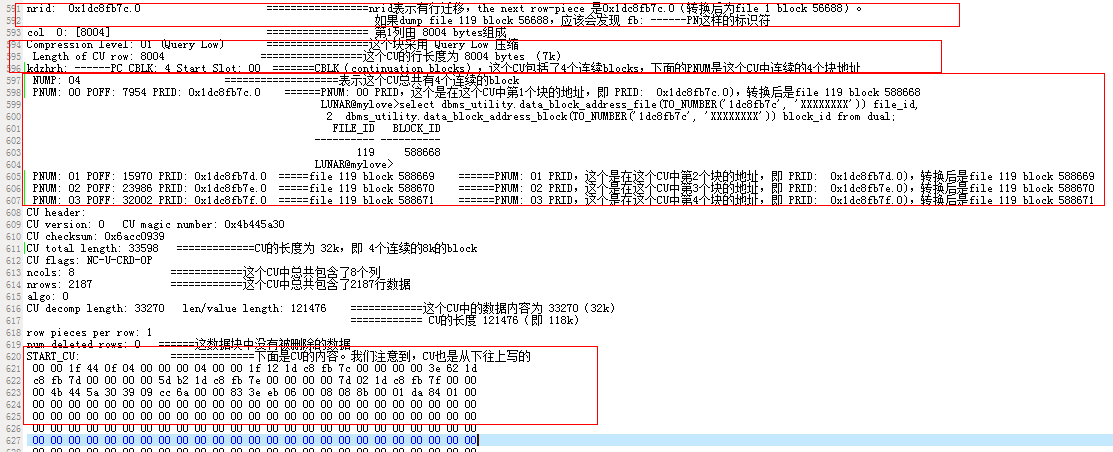
下面以”compress for query low”为例的数据块为例:
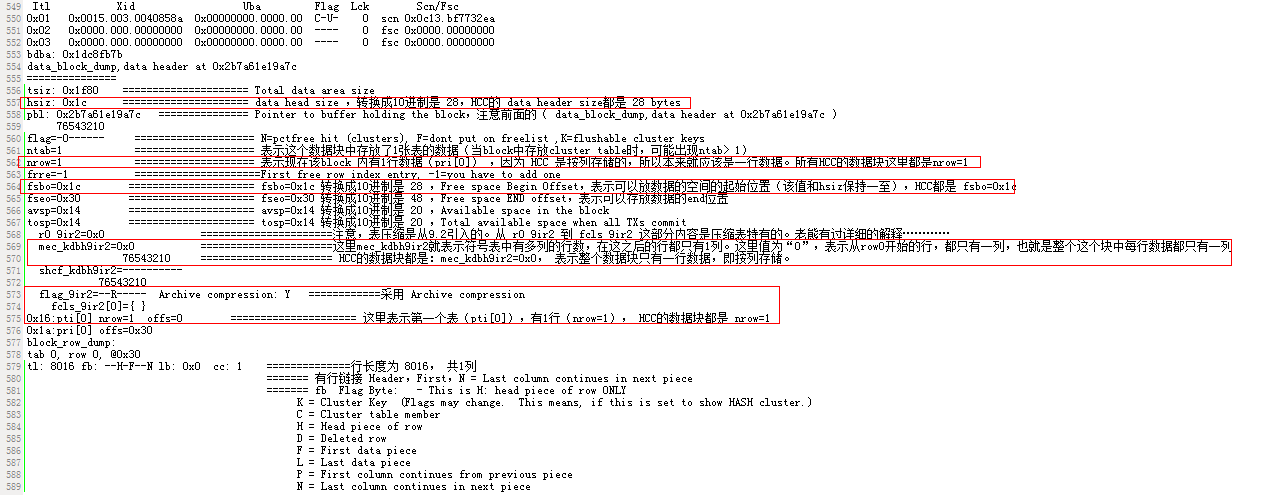
这次测试只dump了一个数据块,因此,不是一个很理想的说明,下次测试我会每个表多dump一些block,再加上表数据的内容,进行对比分析,这样才清晰。O(∩_∩)O哈哈~
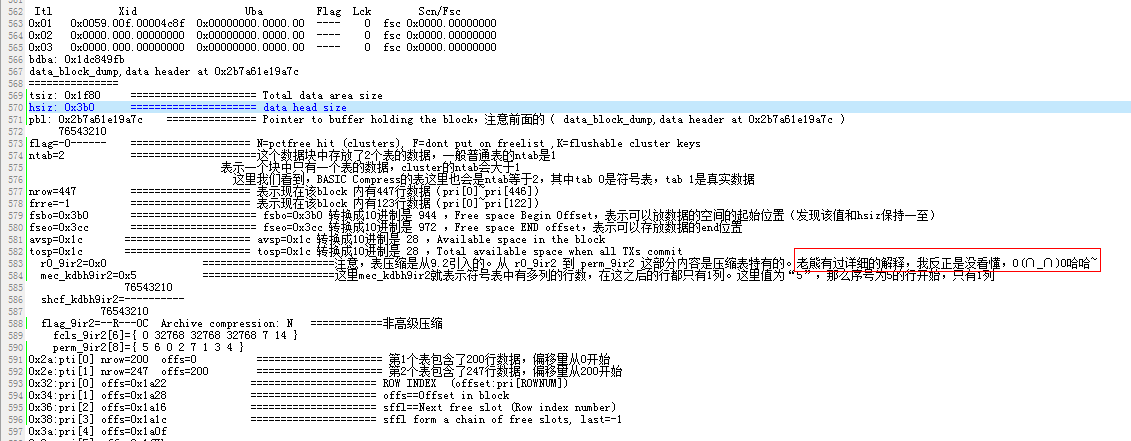
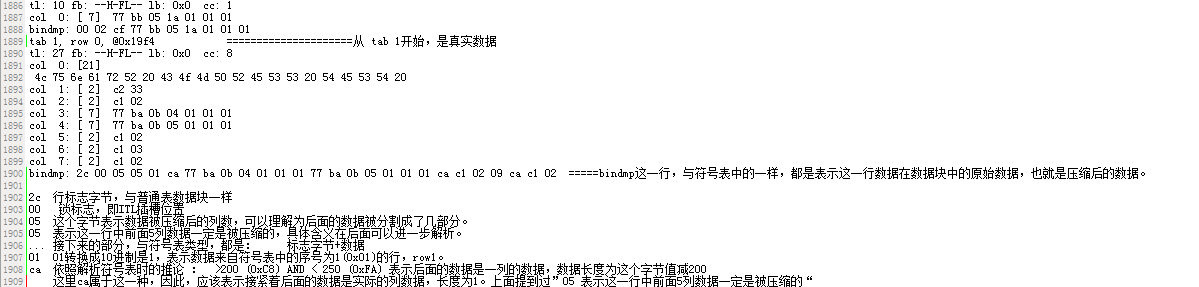
Exadata上HCC表的数据块结构—2-BASIC Compress和OLTP Compress
OLTP 和 BASIC的压缩是符号表(a symbol table)的方式,老熊的blog已经讲的很清晰了,我怎么也不可能比老熊讲的清晰,不赘述了,看图:
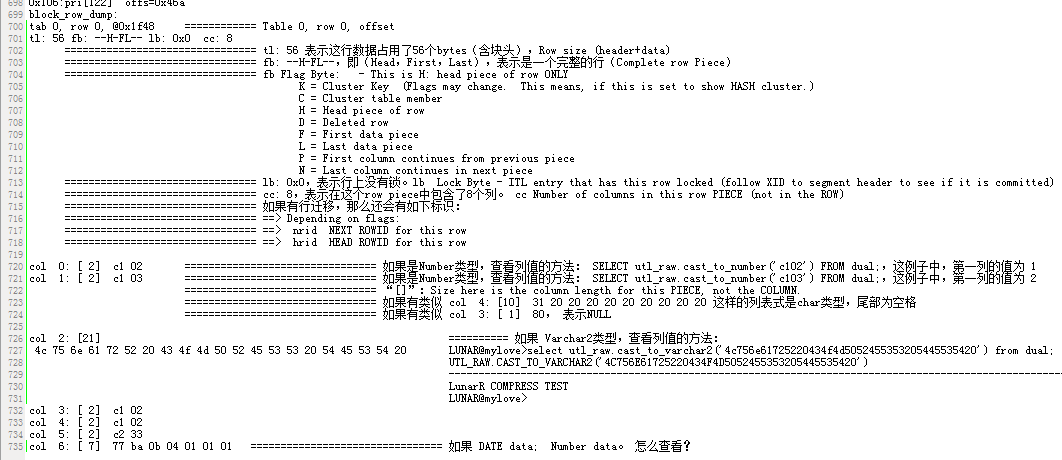
Exadata上HCC表的数据块结构—1-非压缩数据块结构
普通表的数据块结构网上已经铺天盖地了,我就不赘述了,看图:
Exadata上的HCC测试(EHCC)—3—分区表的压缩
Exadata上的HCC测试(EHCC)—2—:DBMS_COMPRESSION.GET_COMPRESSION_RATIO
Exadata上的HCC测试(EHCC)——1
在分区表内部,不同分区可以不同的压缩类型:建立测试表
(注意,还可以按照列选择不同分区,具体参见文档的语法)
CREATE TABLE LUNAR_PAR (
id varchar2(15),
row_num varchar2(15),
name varchar2(50),
DEPT_ID varchar2(15),
STU_ID number,
amount number,
FIRST_DATE date,
END_DATE date)
PARTITION BY RANGE (FIRST_DATE)
(
 partition lunar1 VALUES LESS THAN(TO_DATE('1993-07-01', 'yyyy-mm-dd')) COMPRESS FOR archive high,
 partition lunar2 VALUES LESS THAN(TO_DATE('1998-01-01', 'yyyy-mm-dd')) COMPRESS FOR archive low,
 partition lunar3 VALUES LESS THAN(TO_DATE('2003-12-01', 'yyyy-mm-dd')) COMPRESS FOR query high,
 partition lunar4 VALUES LESS THAN(TO_DATE('2009-07-01', 'yyyy-mm-dd')) COMPRESS FOR query low,
 partition lunar5 VALUES LESS THAN(TO_DATE('2014-12-31', 'yyyy-mm-dd')) nocompress
);
对比插入普通的表(Basic Compress)的时间和插入分区表(不同分区类型)的时间:
insert /*+ append parallel(8)*/ into lunar_comp_basic nologging select * from LUNARTEST;
commit;

LUNAR@mylove>
LUNAR@mylove>insert /*+ append parallel(8)*/ into lunar_comp_basic nologging select * from LUNARTEST;
commit;

20000000 rows created.

Elapsed: 00:00:35.82
LUNAR@mylove>
Commit complete.

Elapsed: 00:00:00.03
LUNAR@mylove>

LUNAR@mylove>insert /*+ append parallel(8)*/ into LUNAR_PAR nologging select * from LUNARTEST;
commit;

20000000 rows created.

Elapsed: 00:01:44.81
LUNAR@mylove>
Commit complete.

Elapsed: 00:00:00.02
LUNAR@mylove>
检查分区表各个分区的分区类型:
LUNAR@mylove>SELECT table_name,partition_name,compression,compress_for FROM USER_TAB_PARTITIONS order by 1,2;

TABLE_NAME                     PARTITION_NAME                 COMPRESS COMPRESS_FOR
------------------------------ ------------------------------ -------- ------------
LUNAR_PAR                      LUNAR1                         ENABLED  ARCHIVE HIGH
LUNAR_PAR                      LUNAR2                         ENABLED  ARCHIVE LOW
LUNAR_PAR                      LUNAR3                         ENABLED  QUERY HIGH
LUNAR_PAR                      LUNAR4                         ENABLED  QUERY LOW
LUNAR_PAR                      LUNAR5                         DISABLED

Elapsed: 00:00:00.05
LUNAR@mylove>
检查每种分区中的记录数据:
LUNAR@mylove>col Compression_type format a50
LUNAR@mylove>SELECT CASE comp_type
  2  WHEN 1 THEN 'No Compression'
  3  WHEN 2 THEN 'Advanced compression level'
  4  WHEN 4 THEN 'Hybrid Columnar Compression for Query High'
  5  WHEN 8 THEN 'Hybrid Columnar Compression for Query Low'
  6  WHEN 16 THEN 'Hybrid Columnar Compression for Archive High'
  7  WHEN 32 THEN 'Hybrid Columnar Compression for Archive Low'
  8  WHEN 64 THEN 'Compressed row'
  9  WHEN 128 THEN 'High compression level for LOB operations'
 10  WHEN 256 THEN 'Medium compression level for LOB operations'
 11  WHEN 512 THEN 'Low compression level for LOB operations'
 12  WHEN 1000 THEN 'Minimum required number of LOBs in the object for which LOB compression ratio is to be estimated'
 13  WHEN 4096 THEN 'Basic compression level'
 14  WHEN 5000 THEN 'Maximum number of LOBs used to compute the LOB compression ratio'
 15  WHEN 1000000 THEN 'Minimum required number of rows in the object for which HCC ratio is to be estimated'
 16  WHEN -1 THEN 'To indicate the use of all the rows in the object to estimate HCC ratio'
 17  WHEN 1 THEN 'Identifies the object whose compression ratio is estimated as of type table'
 18  ELSE 'Unknown Compression Type'
 19  END AS Compression_type,
 20  n as num_rows
 21  FROM (SELECT comp_type,
 22  Count(*) n
 23  FROM (SELECT
 24  dbms_compression.Get_compression_type(USER, 'LUNAR3_PAR', ROWID)
 25  AS comp_type
 26  FROM LUNAR3_PAR)
 27  GROUP BY comp_type);

COMPRESSION_TYPE                                     NUM_ROWS
-------------------------------------------------- ----------
No Compression                                          17240
Hybrid Columnar Compression for Archive Low             16450
Hybrid Columnar Compression for Query High              21600
Hybrid Columnar Compression for Query Low               20390
Hybrid Columnar Compression for Archive High            24320

Elapsed: 00:00:08.20
LUNAR@mylove>
还可以按照rowid来查看压缩情况,输出为一个数字,代表压缩类型,具体的含义上面都有了:
select DBMS_COMPRESSION.GET_COMPRESSION_TYPE('LUNAR', 'LUNARTEST', '&rowid') from dual;
Exadata上的HCC测试(EHCC)—2—:DBMS_COMPRESSION.GET_COMPRESSION_RATIO
今天累了不多说了,官方文档都有:
使用DBMS_COMPRESSION时需要注意,不能两个会话同时使用,否则会报错,类似(2个会话会分别报下面的两个错误):
ERROR at line 1:
ORA-00955: name is already used by an existing object
ORA-06512: at "SYS.PRVT_COMPRESSION", line 774
ORA-06512: at "SYS.DBMS_COMPRESSION", line 214
ORA-06512: at line 26
*
ERROR at line 1:
ORA-08103: object no longer exists
ORA-06512: at "SYS.PRVT_COMPRESSION", line 774
ORA-06512: at "SYS.DBMS_COMPRESSION", line 214
ORA-06512: at line 26
貌似从MOS还是哪里找到的脚本,很好用,其主要是利用了DBMS_COMPRESSION.GET_COMPRESSION_RATIO进行压缩率的测算:
SQL>  declare
  2
  3      /*
  4      COMP_NOCOMPRESS
  5      COMP_FOR_OLTP
  6      COMP_FOR_QUERY_HIGH
  7      COMP_FOR_QUERY_LOW
  8      COMP_FOR_ARCHIVE_HIGH
  9      COMP_FOR_ARCHIVE_LOW
 10      */
 11
 12      lunar_scratchtbsname    varchar2(32) := 'LUNAR';
 13      lunar_ownname       varchar2(32) := 'LUNAR';
 14      lunar_tabname       varchar2(32) := 'LUNARTEST';
 15      lunar_partname      varchar2(32) := null;
 16      lunar_comptype      number(10,0) := dbms_compression.COMP_FOR_ARCHIVE_HIGH;
 17      lunar_blkcnt_cmp        pls_integer;
 18      lunar_blkcnt_uncmp      pls_integer;
 19      lunar_row_cmp       pls_integer;
 20      lunar_row_uncmp         pls_integer;
 21      lunar_cmp_ratio         number;
 22      lunar_comptype_str      varchar2(4000);
 23
 24  begin
 25
 26      DBMS_COMPRESSION.GET_COMPRESSION_RATIO (
 27          scratchtbsname  => lunar_scratchtbsname,
 28          ownname     => lunar_ownname,
 29          tabname     => lunar_tabname,
 30          partname    => lunar_partname,
 31          comptype    => lunar_comptype,
 32          blkcnt_cmp  => lunar_blkcnt_cmp,
 33          blkcnt_uncmp    => lunar_blkcnt_uncmp,
 34          row_cmp     => lunar_row_cmp,
 35          row_uncmp   => lunar_row_uncmp,
 36          cmp_ratio   => lunar_cmp_ratio,
 37          comptype_str    => lunar_comptype_str
 38      );
 39
 40      dbms_output.put_line('Blocks compressed:           ' || lunar_blkcnt_cmp);
 41      dbms_output.put_line('Blocks uncompressed:         ' || lunar_blkcnt_uncmp);
 42      dbms_output.put_line('Rows per block compressed:   ' || lunar_row_cmp);
 43      dbms_output.put_line('Rows per block uncompressed: ' || lunar_row_uncmp);
 44      dbms_output.put_line('Compression Ratio:           ' || lunar_cmp_ratio);
 45      dbms_output.put_line('Comment:                     ' || lunar_comptype_str);
 46
 47  end;
 48  /

select name,value/1024/1024 as mb from v$statname natural join v$mystat
where name = 'cell physical IO interconnect bytes returned by smart scan';

select name,value/1024/1024 as mb from v$statname
natural join v$mystat where name in
(
'physical read total bytes',
'cell physical IO interconnect bytes',
'cell physical IO interconnect bytes returned by smart scan'
);
Compression Advisor self-check validation successful. select count(*) on both Uncompressed and EHCC Compressed format = 1000001 rows
Blocks compressed:           31
Blocks uncompressed:         8994
Rows per block compressed:   32258
Rows per block uncompressed: 111
Compression Ratio:           290.1
Comment:                     "Compress For Archive High"

PL/SQL procedure successfully completed.

Elapsed: 00:00:40.02
SQL> SQL>   2
NAME                                                                     MB
---------------------------------------------------------------- ----------
cell physical IO interconnect bytes returned by smart scan                0

Elapsed: 00:00:00.00
SQL> SQL>   2    3    4    5    6    7
NAME                                                                     MB
---------------------------------------------------------------- ----------
physical read total bytes                                        947.539063
cell physical IO interconnect bytes                              2842.55469
cell physical IO interconnect bytes returned by smart scan                0

Elapsed: 00:00:00.00
SQL>
上面的例子是Compress For Archive High,其他依此类推,测试用例参见:《Exadata上的HCC测试(EHCC)——1》
–Compress For Archive Low:
Compression Advisor self-check validation successful. select count(*) on both Uncompressed and EHCC Compressed format = 1000001 rows
Blocks compressed:           41
Blocks uncompressed:         8994
Rows per block compressed:   24390
Rows per block uncompressed: 111
Compression Ratio:           219.3
Comment:                     "Compress For Archive Low"
–COMP_FOR_OLTP:
Table Compress Type:         COMP_FOR_OLTP
Blocks compressed:           1558
Blocks uncompressed:         2688
Rows per block compressed:   192
Rows per block uncompressed: 111
Compression Ratio:           1.7
Comment:                     "Compress For OLTP"
–Compress For Query High:
Compression Advisor self-check validation successful. select count(*) on both Uncompressed and EHCC Compressed format = 1000001 rows
Blocks compressed:           41
Blocks uncompressed:         8994
Rows per block compressed:   24390
Rows per block uncompressed: 111
Compression Ratio:           219.3
Comment:                     "Compress For Query High"
–Compress For Query Low:
Compression Advisor self-check validation successful. select count(*) on both Uncompressed and EHCC Compressed format = 1000001 rows
Blocks compressed:           1928
Blocks uncompressed:         8994
Rows per block compressed:   519
Rows per block uncompressed: 111
Compression Ratio:           4.6
Comment:                     "Compress For Query Low"
–COMP_NOCOMPRESS:
Table Compress Type:         COMP_NOCOMPRESS
Blocks compressed:           0
Blocks uncompressed:         0
Rows per block compressed:   0
Rows per block uncompressed: 0
Compression Ratio:           0
Comment:
LUNAR@mylove>set lines 155
LUNAR@mylove>compute sum of totalsize_megs on report
LUNAR@mylove>break on report
LUNAR@mylove>col owner for a10
LUNAR@mylove>col segment_name for a30
LUNAR@mylove>col segment_type for a10
LUNAR@mylove>col totalsize_megs for 999,999.9
LUNAR@mylove>col compression_ratio for 999.9
LUNAR@mylove>select owner, segment_name, segment_type type,
  2  sum(bytes/1024/1024) as totalsize_megs,
  3  &original_size/sum(bytes/1024/1024) as compression_ratio
  4  from dba_segments
  5  where owner='LUNAR'
  6  and segment_name like 'LUNAR%'
  7  and segment_type ='TABLE'
  8  group by owner, segment_name, tablespace_name, segment_type
  9  order by 5;
Enter value for original_size: 1472
old   3: &original_size/sum(bytes/1024/1024) as compression_ratio
new   3: 1472/sum(bytes/1024/1024) as compression_ratio

OWNER      SEGMENT_NAME                   TYPE               TOTALSIZE_MEGS COMPRESSION_RATIO
---------- ------------------------------ ------------------ -------------- -----------------
LUNAR      LUNARTEST                      TABLE                     1,472.0               1.0
LUNAR      LUNAR_COMP_OLTP                TABLE                       904.0               1.6
LUNAR      LUNAR_COMP_BASIC               TABLE                       736.0               2.0
LUNAR      LUNAR_COMP_QUERY_LOW           TABLE                       304.0               4.8
LUNAR      LUNAR_COMP_QUERY_HIGH          TABLE                         8.0             184.0
LUNAR      LUNAR_COMP_ARCHIVE_LOW         TABLE                         8.0             184.0
LUNAR      LUNAR_COMP_ARCHIVE_HIGH        TABLE                         5.0             294.4
                                                             --------------
sum                                                                 3,437.0

7 rows selected.

Elapsed: 00:00:00.08
LUNAR@mylove>
Exadata上的HCC测试(EHCC)——1
Exadata上的HCC测试(EHCC)—2—:DBMS_COMPRESSION.GET_COMPRESSION_RATIO
Exadata上的HCC测试(EHCC)—3—分区表的压缩
Oracle 从8.1.5开始引入了“Index key compression”压缩,也就是重复的索引键值可以被压缩。
.
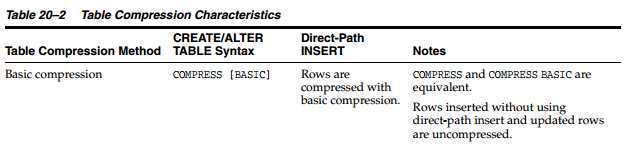
从9.2开始引入了“Data segment compression”,也就是我们说的“Basic compression”,但是该功能只有在批量数据加载时才生效(比如直接路径装载,CTAS等)。
.
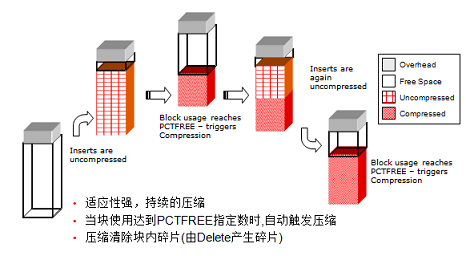
从Oracle11.1版本引入了Advanced Compression,支持OLTP的压缩,也就是说可以支持INSERT,DELETE,UPDATE操作的压缩。
(正式发布的11g最早版本是2008年OOW上的11.1.0.6.x,2009年我就有客户用这个版本的了,而且一次上了4中平台的RAC,O(∩_∩)O哈哈~)
.
当然,从11g开始,Oracle很多其他操作也支持压缩,比如,非结构化数据压缩(SecureFile数据压缩),Data Pump数据压缩,以及RMAN备份压缩等等,这里不做赘述。
支持OLTP的压缩,不代表每个DML语句执行时都会启用同步压缩,也就是说,只有当数据块中未压缩的数据达到一个阀值的时候,才会启动压缩,而不是每个DML语句之后都会压缩。如图:
关于压缩表的限制:
1)Compressed tables can only have columns added or dropped if the COMPRESS FOR ALL OPERATIONS option was used.
2)Compressed tables must not have more than 255 columns.
3)Compression is not applied to lob segments.
4)Table compression is only valid for heap organized tables, not index organized tables.
5)The compression clause cannot be applied to hash or hash-list partitions. Instead, they must inherit their compression settings from the tablespace, table or partition settings.
6)Table compression cannot be specified for external or clustered tables.
更多内容请参考 Notes 882712.1。
这里主要讨论下EHCC(Exadata Hybrid Columnar Compression ),官方文档说明如下:
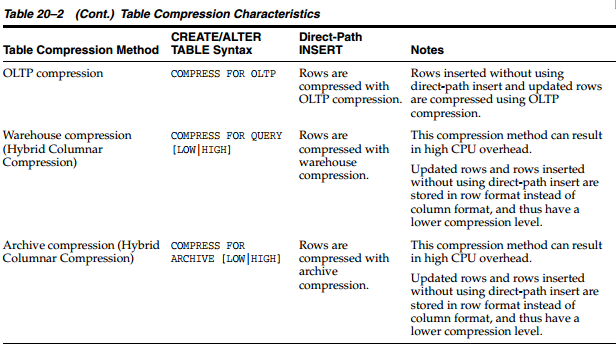
关于测试创建各类压缩表的创建消耗的时间和IO的统计如下,我就不说了,有兴趣的自己看吧,O(∩_∩)O哈哈~
--- OLTP method
SQL> create table lunar_comp_classic compress as select * from LUNARTEST where 1=2;

Table created.

Elapsed: 00:00:00.03
SQL> select name,value/1024/1024 as mb from v$statname natural join v$mystat
  2  where name = 'cell physical IO interconnect bytes returned by smart scan';

NAME                                                                     MB
---------------------------------------------------------------- ----------
cell physical IO interconnect bytes returned by smart scan                0

Elapsed: 00:00:00.01
SQL> select name,value/1024/1024 as mb from v$statname
  2  natural join v$mystat where name in
  3  (
  4  'physical read total bytes',
  5  'cell physical IO interconnect bytes',
  6  'cell physical IO interconnect bytes returned by smart scan'
  7  );

NAME                                                                     MB
---------------------------------------------------------------- ----------
physical read total bytes                                                 0
cell physical IO interconnect bytes                                       0
cell physical IO interconnect bytes returned by smart scan                0

Elapsed: 00:00:00.01
SQL> alter table lunar_comp_classic nologging;

Table altered.

Elapsed: 00:00:00.01
SQL>
SQL> insert /*+ append */ into lunar_comp_classic select * from LUNARTEST;
commit;
select name,value/1024/1024 as mb from v$statname natural join v$mystat
where name = 'cell physical IO interconnect bytes returned by smart scan';


select name,value/1024/1024 as mb from v$statname
natural join v$mystat where name in
(
'physical read total bytes',
'cell physical IO interconnect bytes',
'cell physical IO interconnect bytes returned by smart scan'
);


20000000 rows created.

Elapsed: 00:00:31.97
SQL>
Commit complete.

Elapsed: 00:00:00.01
SQL>   2
NAME                                                                     MB
---------------------------------------------------------------- ----------
cell physical IO interconnect bytes returned by smart scan                0

Elapsed: 00:00:00.00
SQL> SQL> SQL>   2    3    4    5    6    7
NAME                                                                     MB
---------------------------------------------------------------- ----------
physical read total bytes                                                 0
cell physical IO interconnect bytes                              1463.29688
cell physical IO interconnect bytes returned by smart scan                0

Elapsed: 00:00:00.00
SQL> SQ


--OLTP.
SQL> create table lunar_comp_oltp compress for oltp as select * from LUNARTEST where 1=2;
insert into lunar_comp_oltp select * from LUNARTEST;
commit;
Table created.

Elapsed: 00:00:00.02
SQL>

select name,value/1024/1024 as mb from v$statname natural join v$mystat
where name = 'cell physical IO interconnect bytes returned by smart scan';

select name,value/1024/1024 as mb from v$statname
natural join v$mystat where name in
(
'physical read total bytes',
'cell physical IO interconnect bytes',
'cell physical IO interconnect bytes returned by smart scan'
);

20000000 rows created.

Elapsed: 00:01:50.14
SQL>
Commit complete.

Elapsed: 00:00:00.14
SQL> SQL>   2
NAME                                                                     MB
---------------------------------------------------------------- ----------
cell physical IO interconnect bytes returned by smart scan                0

Elapsed: 00:00:00.00
SQL> SQL>   2    3    4    5    6    7
NAME                                                                     MB
---------------------------------------------------------------- ----------
physical read total bytes                                                 0
cell physical IO interconnect bytes                                       0
cell physical IO interconnect bytes returned by smart scan                0

Elapsed: 00:00:00.00
SQL>


--QUERY LOW method.
SQL> create table lunar_comp_query_low compress for query low as select * from LUNARTEST where 1=2;
alter table lunar_comp_query_low nologging;
insert /*+ append */ into lunar_comp_query_low select * from LUNARTEST;

Table created.

Elapsed: 00:00:00.02
SQL> commit;

Table altered.

Elapsed: 00:00:00.00
SQL>


select name,value/1024/1024 as mb from v$statname natural join v$mystat
where name = 'cell physical IO interconnect bytes returned by smart scan';

select name,value/1024/1024 as mb from v$statname
natural join v$mystat where name in
(
'physical read total bytes',
'cell physical IO interconnect bytes',
'cell physical IO interconnect bytes returned by smart scan'
);


20000000 rows created.

Elapsed: 00:00:20.33
SQL>
Commit complete.

Elapsed: 00:00:00.00
SQL> SQL> SQL> SQL>   2
NAME                                                                     MB
---------------------------------------------------------------- ----------
cell physical IO interconnect bytes returned by smart scan                0

Elapsed: 00:00:00.00
SQL> SQL>   2    3    4    5    6    7
NAME                                                                     MB
---------------------------------------------------------------- ----------
physical read total bytes                                                 0
cell physical IO interconnect bytes                               600.71875
cell physical IO interconnect bytes returned by smart scan                0

Elapsed: 00:00:00.00
SQL> SQL>


--QUERY HIGH method.
SQL> create table lunar_comp_query_high compress for query high as select * from LUNARTEST where 1=2;
alter table lunar_comp_query_high nologging;
insert /*+ append */ into lunar_comp_query_high select * from LUNARTEST;
commit;


select name,value/1024/1024 as mb from v$statname natural join v$mystat
where name = 'cell physical IO interconnect bytes returned by smart scan';

select name,value/1024/1024 as mb from v$statname
natural join v$mystat where name in
(

Table created.

Elapsed: 00:00:00.07
SQL> 'physical read total bytes',

Table altered.

Elapsed: 00:00:00.01
SQL> 'cell physical IO interconnect bytes',
'cell physical IO interconnect bytes returned by smart scan'
);


20000000 rows created.

Elapsed: 00:00:29.26
SQL>
Commit complete.

Elapsed: 00:00:00.10
SQL> SQL> SQL>   2
NAME                                                                     MB
---------------------------------------------------------------- ----------
cell physical IO interconnect bytes returned by smart scan                0

Elapsed: 00:00:00.00
SQL> SQL>   2    3    4    5    6    7
NAME                                                                     MB
---------------------------------------------------------------- ----------
physical read total bytes                                                 0
cell physical IO interconnect bytes                                 14.3125
cell physical IO interconnect bytes returned by smart scan                0

Elapsed: 00:00:00.00
SQL> SQL> SQL>


--ARCHIVE LOW method.
SQL> create table lunar_comp_archive_low compress for archive low as select * from LUNARTEST where 1=2;
alter table lunar_comp_archive_low nologging;
insert /*+ append */ into lunar_comp_archive_low select * from LUNARTEST;
commit;

select name,value/1024/1024 as mb from v$statname natural join v$mystat
where name = 'cell physical IO interconnect bytes returned by smart scan';

select name,value/1024/1024 as mb from v$statname
natural join v$mystat where name in
(
'physical read total bytes',
'cell physical IO interconnect bytes',
'cell physical IO interconnect bytes returned by smart scan'
);
Table created.

Elapsed: 00:00:00.20
SQL>
Table altered.

Elapsed: 00:00:00.20
SQL>

20000000 rows created.

Elapsed: 00:00:28.07
SQL>
Commit complete.

Elapsed: 00:00:00.00
SQL> SQL>   2
NAME                                                                     MB
---------------------------------------------------------------- ----------
cell physical IO interconnect bytes returned by smart scan                0

Elapsed: 00:00:00.01
SQL> SQL>   2    3    4    5    6    7
NAME                                                                     MB
---------------------------------------------------------------- ----------
physical read total bytes                                                 0
cell physical IO interconnect bytes                                 14.3125
cell physical IO interconnect bytes returned by smart scan                0

Elapsed: 00:00:00.00
SQL> SQL> SQL> SQL> SQL>


--ARCHIVE HIGH method.
SQL> create table lunar_comp_archive_high compress for archive high as select * from LUNARTEST where 1=2;
alter table lunar_comp_archive_high nologging;
insert /*+ append */ into lunar_comp_archive_high select * from LUNARTEST;
commit;

Table created.

Elapsed: 00:00:00.02
SQL>

Table altered.

Elapsed: 00:00:00.01
SQL> select name,value/1024/1024 as mb from v$statname natural join v$mystat
where name = 'cell physical IO interconnect bytes returned by smart scan';

select name,value/1024/1024 as mb from v$statname
natural join v$mystat where name in
(
'physical read total bytes',
'cell physical IO interconnect bytes',
'cell physical IO interconnect bytes returned by smart scan'
);


20000000 rows created.

Elapsed: 00:04:01.13
SQL>
Commit complete.

Elapsed: 00:00:00.01
SQL> SQL>   2
NAME                                                                     MB
---------------------------------------------------------------- ----------
cell physical IO interconnect bytes returned by smart scan                0

Elapsed: 00:00:00.00
SQL> SQL>   2    3    4    5    6    7
NAME                                                                     MB
---------------------------------------------------------------- ----------
physical read total bytes                                                 0
cell physical IO interconnect bytes                                9.546875
cell physical IO interconnect bytes returned by smart scan                0

Elapsed: 00:00:00.00
SQL> SQL>

LUNAR@mylove>SELECT SEGMENT_NAME,
  2  BYTES/1024/1024 MB
  3  FROM USER_SEGMENTS
  4  WHERE SEGMENT_NAME LIKE 'LUNAR%'or SEGMENT_NAME LIKE 'LUNAR_%';

SEGMENT_NAME                                                                              MB
--------------------------------------------------------------------------------- ----------
LUNARTEST                                                                               1472
LUNAR_COMP_ARCHIVE_HIGH                                                                    5
LUNAR_COMP_ARCHIVE_LOW                                                                     8
LUNAR_COMP_BASIC                                                                         736
LUNAR_COMP_OLTP                                                                          904
LUNAR_COMP_QUERY_HIGH                                                                      8
LUNAR_COMP_QUERY_LOW                                                                     304

7 rows selected.

Elapsed: 00:00:00.08
LUNAR@mylove>


LUNAR@mylove>set lines 155
LUNAR@mylove>compute sum of totalsize_megs on report
LUNAR@mylove>break on report
LUNAR@mylove>col owner for a10
LUNAR@mylove>col segment_name for a30
LUNAR@mylove>col segment_type for a10
LUNAR@mylove>col totalsize_megs for 999,999.9
LUNAR@mylove>col compression_ratio for 999.9
LUNAR@mylove>select owner, segment_name, segment_type type,
  2  sum(bytes/1024/1024) as totalsize_megs,
  3  &original_size/sum(bytes/1024/1024) as compression_ratio
  4  from dba_segments
  5  where owner='LUNAR'
  6  and segment_name like 'LUNAR%'
  7  and segment_type ='TABLE'
  8  group by owner, segment_name, tablespace_name, segment_type
  9  order by 5;
Enter value for original_size: 1472
old   3: &original_size/sum(bytes/1024/1024) as compression_ratio
new   3: 1472/sum(bytes/1024/1024) as compression_ratio

OWNER      SEGMENT_NAME                   TYPE               TOTALSIZE_MEGS COMPRESSION_RATIO
---------- ------------------------------ ------------------ -------------- -----------------
LUNAR      LUNARTEST                      TABLE                     1,472.0               1.0
LUNAR      LUNAR_COMP_OLTP                TABLE                       904.0               1.6
LUNAR      LUNAR_COMP_BASIC               TABLE                       736.0               2.0
LUNAR      LUNAR_COMP_QUERY_LOW           TABLE                       304.0               4.8
LUNAR      LUNAR_COMP_QUERY_HIGH          TABLE                         8.0             184.0
LUNAR      LUNAR_COMP_ARCHIVE_LOW         TABLE                         8.0             184.0
LUNAR      LUNAR_COMP_ARCHIVE_HIGH        TABLE                         5.0             294.4
                                                             --------------
sum                                                                 3,437.0

7 rows selected.

Elapsed: 00:00:00.08
LUNAR@mylove>
kcfis的相关隐含参数
记录一下kcfis的相关隐含参数:
LUNAR@bbff1>set lines 150 pages 9999
LUNAR@bbff1>column name format a55
LUNAR@bbff1>column session_value format a14
LUNAR@bbff1>col KSPPINM for a40
LUNAR@bbff1>col ksppstvl format a15
LUNAR@bbff1>col KSPPDESC for a65
LUNAR@bbff1>select ksppinm, ksppstvl, KSPPDESC
  2  from x$ksppi pi, x$ksppcv cv
  3  where cv.indx=pi.indx and pi.ksppinm like '\_%' escape '\'
  4   and pi.ksppinm like '%kcfis%';

KSPPINM                                  KSPPSTVL        KSPPDESC
---------------------------------------- --------------- -----------------------------------------------------------------
_kcfis_trace_level                       0               sets kcfis tracing level
_kcfis_spawn_debugger                    FALSE           Decides whether to spawn the debugger at kcfis initialize
_kcfis_trace_bucket_size                 131072          KCFIS tracing bucket size in bytes
_kcfis_fault_control                     0               Fault Injection Control
_kcfis_caching_enabled                   TRUE            enable kcfis intra-scan session caching
_kcfis_large_payload_enabled             FALSE           enable large payload to be passed to cellsrv
_kcfis_cell_passthru_enabled             FALSE           Do not perform smart IO filtering on the cell
_kcfis_dump_corrupt_block                TRUE            Dump any corrupt blocks found during smart IO
_kcfis_kept_in_cellfc_enabled            TRUE            Enable usage of cellsrv flash cache for kept objects
_kcfis_nonkept_in_cellfc_enabled         FALSE           Enable use of cellsrv flash cache for non-kept objects
_kcfis_rdbms_blockio_enabled             FALSE           Use block IO instead of smart IO in the smart IO module on RDBMS
_kcfis_fast_response_enabled             TRUE            Enable smart scan optimization for fast response (first rows)
_kcfis_fast_response_threshold           1048576         Fast response - the number of IOs after which smartIO is used
_kcfis_fast_response_initiosize          2               Fast response - The size of the first IO in logical blocks
_kcfis_fast_response_iosizemult          4               Fast response - (next IO size = current IO size * this parameter)
_kcfis_max_out_translations              5000            Sets the maximum number of outstanding translations in kcfis
_kcfis_max_cached_sessions               10              Sets the maximum number of kcfis sessions cached
_kcfis_storageidx_disabled               FALSE           Don't use storage index optimization on the storage cell
_kcfis_disable_platform_decryption       FALSE           Don't use platform-specific decryption on the storage cell
_kcfis_storageidx_diag_mode              0               Debug mode for storage index on the cell
_kcfis_test_control1                     0               kcfis tst control1
_kcfis_stats_level                       0               sets kcfis stats level
_kcfis_io_prefetch_size                  8               Smart IO prefetch size for a cell
_kcfis_block_dump_level                  0               Smart IO block dump level
_kcfis_ioreqs_throttle_enabled           TRUE            Enable Smart IO requests throttling
_kcfis_work_set_appliances               2               Working Set of appliances in a KCFIS session
_kcfis_control1                          0               Kcfis control1
_kcfis_control2                          0               Kcfis control2
_kcfis_control3                          0               Kcfis control3
_kcfis_control4                          0               Kcfis control4
_kcfis_control5                          0               Kcfis control5
_kcfis_control6                          0               Kcfis control6
_kcfis_oss_io_size                       0               KCFIS OSS I/O size
_kcfis_read_buffer_limit                 0               KCFIS Read Buffer (per session) memory limit in bytes
_kcfis_cell_passthru_fromcpu_enabled     TRUE            Enable automatic passthru mode when cell CPU util is too high

35 rows selected.

Elapsed: 00:00:08.05
LUNAR@bbff1>
Exadata上cell如何判断何时进行智能扫描?————2.在非Exadata环境的测试
创建测试表:
LUNAR@lunar>create table lunar as select * from dba_objects where rownum<=100;

Table created.

Elapsed: 00:00:00.35
LUNAR@lunar>select pid, spid from v$process p, v$session s where p.addr = s.paddr and s.sid=(select sid from v$mystat where rownum=1);

       PID SPID
---------- ------------------------------------------------
        24 12868

Elapsed: 00:00:00.05
LUNAR@lunar>
使用gdb跟踪:
———— 回到 session 2 —————-
(gdb) c
Continuing.
继续跟踪
———— 回到 session 1 —————-
执行: LUNAR@lunar>select count(1) from lunar;
…….
———— 回到 session 2 继续跟踪 —————-
(gdb) c
Continuing.

Breakpoint 6, 0x00000000021c9cd6 in kcfis_tablespace_is_on_sage ()
(gdb) c
Continuing.

Breakpoint 6, 0x00000000021c9cd6 in kcfis_tablespace_is_on_sage ()
(gdb)
———— 回到 session 1 —————-
回到session 1,此时已经返回了结果:
LUNAR@lunar>select count(1) from lunar;
COUNT(1)
———-
100
Elapsed: 00:00:03.91
LUNAR@lunar>
[/shell]
我们看到,在非Exadata环境上,只执行了2次kcfis_tablespace_is_on_sage的判断,猜测该调用主要是针对执行计划中的两个语句涉及到的相关兑现搞定判断,判断他们是否在SAGE上,SAGE(Storage Appliance for Grid Environments)是Exadata最早的雏形,也是Oracle内部开发时该项目的名称。
在非Exadata上发现表空间不在SAGE上,因此执行了普通的块扫描而非Smart Scan。
.
对该语句执行event 10046 跟踪,我们看到,该语句是执行了“TABLE ACCESS FULL LUNAR”的全表扫描:
=====================
PARSING IN CURSOR #140534602396616 len=26 dep=0 uid=37 oct=3 lid=37 tim=1393962423520613 hv=3764746106 ad='7e125b28' sqlid='dprpmj3h6axvu'
select count(1) from lunar
END OF STMT
PARSE #140534602396616:c=7998,e=76754,p=0,cr=5,cu=0,mis=1,r=0,dep=0,og=1,plh=291688323,tim=1393962423520609
EXEC #140534602396616:c=0,e=50,p=0,cr=0,cu=0,mis=0,r=0,dep=0,og=1,plh=291688323,tim=1393962423520740
WAIT #140534602396616: nam='SQL*Net message to client' ela= 5 driver id=1650815232 #bytes=1 p3=0 obj#=282 tim=1393962423520811
FETCH #140534602396616:c=1000,e=145,p=0,cr=4,cu=0,mis=0,r=1,dep=0,og=1,plh=291688323,tim=1393962423520990
STAT #140534602396616 id=1 cnt=1 pid=0 pos=1 obj=0 op='SORT AGGREGATE (cr=4 pr=0 pw=0 time=146 us)'
STAT #140534602396616 id=2 cnt=100 pid=1 pos=1 obj=18207 op='TABLE ACCESS FULL LUNAR (cr=4 pr=0 pw=0 time=335 us cost=3 size=0 card=100)'
WAIT #140534602396616: nam='SQL*Net message from client' ela= 216 driver id=1650815232 #bytes=1 p3=0 obj#=282 tim=1393962423521304
FETCH #140534602396616:c=0,e=4,p=0,cr=0,cu=0,mis=0,r=0,dep=0,og=0,plh=291688323,tim=1393962423521371
WAIT #140534602396616: nam='SQL*Net message to client' ela= 4 driver id=1650815232 #bytes=1 p3=0 obj#=282 tim=1393962423521406

*** 2014-03-04 11:47:10.737
WAIT #140534602396616: nam='SQL*Net message from client' ela= 7215730 driver id=1650815232 #bytes=1 p3=0 obj#=282 tim=1393962430737152
CLOSE #140534602396616:c=0,e=80,dep=0,type=0,tim=1393962430737559
WAIT #0: nam='SQL*Net message to client' ela= 16 driver id=1650815232 #bytes=1 p3=0 obj#=282 tim=1393962430737806
WAIT #0: nam='SQL*Net message from client' ela= 20602 driver id=1650815232 #bytes=1 p3=0 obj#=282 tim=1393962430758517
WAIT #0: nam='SQL*Net message to client' ela= 18 driver id=1650815232 #bytes=1 p3=0 obj#=282 tim=1393962430759305
WAIT #0: nam='SQL*Net message from client' ela= 8527 driver id=1650815232 #bytes=1 p3=0 obj#=282 tim=1393962430767944
WAIT #0: nam='SQL*Net message to client' ela= 13 driver id=1650815232 #bytes=1 p3=0 obj#=282 tim=1393962430768344
格式化后的结果:
********************************************************************************

SQL ID: dprpmj3h6axvu Plan Hash: 291688323

select count(1)
from
 lunar


call     count       cpu    elapsed       disk      query    current        rows
------- ------  -------- ---------- ---------- ---------- ----------  ----------
Parse        1      0.00       0.07          0          5          0           0
Execute      1      0.00       0.00          0          0          0           0
Fetch        2      0.00       0.00          0          4          0           1
------- ------  -------- ---------- ---------- ---------- ----------  ----------
total        4      0.00       0.07          0          9          0           1

Misses in library cache during parse: 1
Optimizer mode: ALL_ROWS
Parsing user id: 37
Number of plan statistics captured: 1

Rows (1st) Rows (avg) Rows (max)  Row Source Operation
---------- ---------- ----------  ---------------------------------------------------
         1          1          1  SORT AGGREGATE (cr=4 pr=0 pw=0 time=146 us)
       100        100        100   TABLE ACCESS FULL LUNAR (cr=4 pr=0 pw=0 time=335 us cost=3 size=0 card=100)


Elapsed times include waiting on following events:
  Event waited on                             Times   Max. Wait  Total Waited
  ----------------------------------------   Waited  ----------  ------------
  SQL*Net message from client                     3      228.94        236.16
  SQL*Net message to client                       2        0.00          0.00


********************************************************************************
结论:
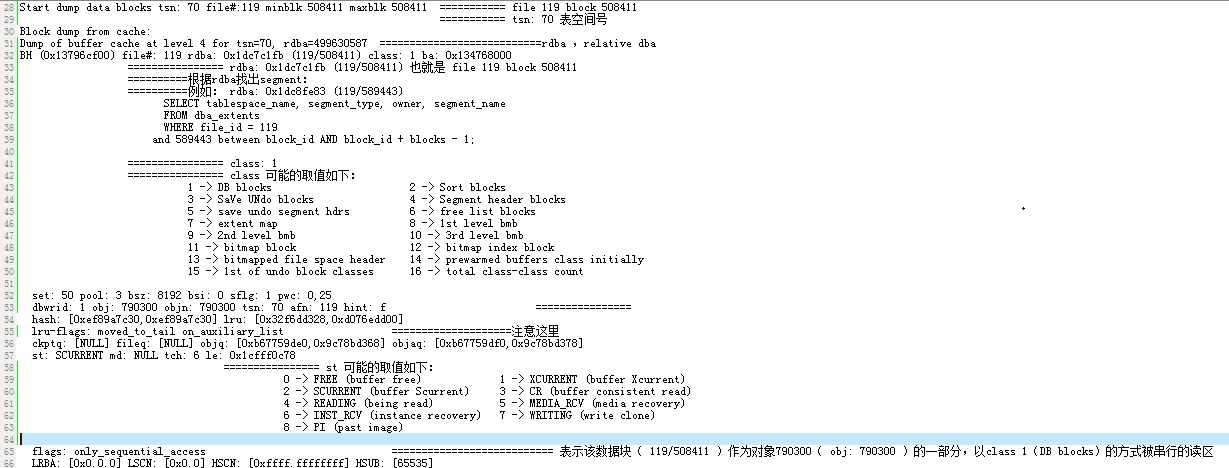
根据kcfis_tablespace_is_on_sage判断数据是否在cell上
Exadata上cell如何判断何时进行智能扫描?————1.在Exadata环境的测试
我们知道,SmartScan的先决条件是下面3个:
1,必须是对象上的全表扫描或者全索引快速扫描(TABLE ACCESS FULL或INDEX FAST FULL SCAN)
2,必须使用直接路径读取(Direct Path Read)。SmartScan的数据流是无法缓存在SGA缓冲池中的。直接路径读取可以串行,也可以并行,缓冲在进程的PGA(heap)中。
3,对象必须存储在Exadata的Cell节点上
.
在Exadata环境的数据库节点上:
1,ASM实例使用libcell11.a这个动态库跟cell节点通信,
2,数据库实例使用kcfis( Kernel File Intelligent Storage )执行SmartScan。
3,Diskmon进行心跳监控,I/O fencing和IORM 。
.
而cell节点上,主要是cellsrv(多线程的服务)完成相关的IO请求的操作(MS主要是监控,RS是重启其他进程)
.
并且,对于Linux环境,Exadata和非Exadata上面安装的Oracle介质并无却别,那么有两个问题:
1,这两个环境是上执行计划为什么会不同(一个是全表扫描,一个是智能扫描)?
2,cell在收到数据库节点的请求后,怎么判断是否执行只能扫描呢?
.
首先,在Exadata上大体有下面3种读取数据块的方式:
1,普通的block读:从磁盘读取数据块,读入到SGA
2,直接路径读:从磁盘读取数据块,读入PGA
3,智能扫描:由cell直接从底盘读取,读入PGA
.
而在非Exadata环境,通常只有前两种。
我们分别用gdb跟踪一下。
首先在我的Exadata VM上测试:
创建测试表:
------------ session 1 ----------------
LUNAR@lunar>create table lunar as select * from dba_objects where rownum<=100;

Table created.

Elapsed: 00:00:00.35
LUNAR@lunar>select pid, spid from v$process p, v$session s where p.addr = s.paddr and s.sid=(select sid from v$mystat where rownum=1);

       PID SPID
---------- ------------------------------------------------
        24 12868

Elapsed: 00:00:00.05
LUNAR@lunar>
使用gdb跟踪这个会话:
———— 回到 session 2 —————-
(gdb) c
Continuing.
继续跟踪
———— 回到 session 1 —————-
执行: LUNAR@bbff1>select count(1) from lunar;
hang住,等待gdb继续跟踪……
———— 回到 session 2 继续跟踪 —————-
(gdb) c
Continuing.

Breakpoint 6, 0x00000000021c9cd6 in kcfis_tablespace_is_on_sage ()
(gdb) c
Continuing.

Breakpoint 170, 0x000000000681b1b6 in kcfis_tbs_storage_attr ()
(gdb) c
Continuing.

Breakpoint 14, 0x00000000021cb0ae in kcfis_get_ts_attrs ()
(gdb) c
Continuing.

Breakpoint 2, 0x00000000021c9bee in kcfis_capability_tab_get ()
(gdb) c
Continuing.

Breakpoint 2, 0x00000000021c9bee in kcfis_capability_tab_get ()
(gdb) c
Continuing.

Breakpoint 6, 0x00000000021c9cd6 in kcfis_tablespace_is_on_sage ()
(gdb) c
Continuing.

Breakpoint 170, 0x000000000681b1b6 in kcfis_tbs_storage_attr ()
(gdb) c
Continuing.

Breakpoint 14, 0x00000000021cb0ae in kcfis_get_ts_attrs ()
(gdb) c
Continuing.

Breakpoint 2, 0x00000000021c9bee in kcfis_capability_tab_get ()
(gdb) c
Continuing.

Breakpoint 2, 0x00000000021c9bee in kcfis_capability_tab_get ()
(gdb) c
Continuing.

Breakpoint 6, 0x00000000021c9cd6 in kcfis_tablespace_is_on_sage ()
(gdb) c
Continuing.

Breakpoint 170, 0x000000000681b1b6 in kcfis_tbs_storage_attr ()
(gdb) c
Continuing.

Breakpoint 14, 0x00000000021cb0ae in kcfis_get_ts_attrs ()
(gdb) c
Continuing.

Breakpoint 2, 0x00000000021c9bee in kcfis_capability_tab_get ()
(gdb) c
Continuing.
c

Breakpoint 6, 0x00000000021c9cd6 in kcfis_tablespace_is_on_sage ()
(gdb) c
Continuing.

Breakpoint 170, 0x000000000681b1b6 in kcfis_tbs_storage_attr ()
(gdb) c
Continuing.

Breakpoint 14, 0x00000000021cb0ae in kcfis_get_ts_attrs ()
(gdb) c
Continuing.

Breakpoint 6, 0x00000000021c9cd6 in kcfis_tablespace_is_on_sage ()
(gdb) c
Continuing.

Breakpoint 170, 0x000000000681b1b6 in kcfis_tbs_storage_attr ()
(gdb) c
Continuing.

Breakpoint 14, 0x00000000021cb0ae in kcfis_get_ts_attrs ()
(gdb) c
Continuing.
———— 回到 session 1 —————-
这时,我们看到session已经返回了结果:
LUNAR@bbff1>select count(1) from lunar;

  COUNT(1)
----------
       100

Elapsed: 00:01:58.50
LUNAR@bbff1>
我们发现,对于这个SQL的执行,基本上是反复重复下面的动作,这里例子中是重复做了8次:(后面注释为个人猜测)
Breakpoint 2, 0x00000000021c9bee in kcfis_capability_tab_get ()      ---猜测是读表的大小或者各种存储属性等等(storage参数的相关内容,是否压缩,是否加密等等)
Breakpoint 6, 0x00000000021c9cd6 in kcfis_tablespace_is_on_sage ()   ---判断表空间是否在cell上,也就是SAGE(Storage Appliance for Grid Environments)是Exadata最早的雏形,也是Oracle内部开发时该项目的名称
Breakpoint 170, 0x000000000681b1b6 in kcfis_tbs_storage_attr ()      ---判断表空间的属性 1
Breakpoint 14, 0x00000000021cb0ae in kcfis_get_ts_attrs ()           ---判断表空间的属性 2  猜测这两判断的来源应该不同
在使用event 10046跟踪一下:
LUNAR@bbff1>select pid, spid from v$process p, v$session s where p.addr = s.paddr and s.sid=(select sid from v$mystat where rownum=1);

       PID SPID
---------- ------------------------
        32 20361

Elapsed: 00:00:06.14
LUNAR@bbff1>
从跟踪文件上看,执行计划是“TABLE ACCESS STORAGE FULL LUNAR”,确实是Smart Scan:
PARSING IN CURSOR #47327115779400 len=26 dep=0 uid=37 oct=3 lid=37 tim=1394896509806091 hv=3764746106 ad='7e7afa50' sqlid='dprpmj3h6axvu'
select count(1) from lunar
END OF STMT
PARSE #47327115779400:c=32002,e=4391771,p=0,cr=5,cu=0,mis=1,r=0,dep=0,og=1,plh=291688323,tim=1394896509806089
EXEC #47327115779400:c=0,e=628,p=0,cr=0,cu=0,mis=0,r=0,dep=0,og=1,plh=291688323,tim=1394896509806815
WAIT #47327115779400: nam='SQL*Net message to client' ela= 8 driver id=1650815232 #bytes=1 p3=0 obj#=-1 tim=1394896509806894
FETCH #47327115779400:c=0,e=74,p=0,cr=4,cu=0,mis=0,r=1,dep=0,og=1,plh=291688323,tim=1394896509806997
STAT #47327115779400 id=1 cnt=1 pid=0 pos=1 obj=0 op='SORT AGGREGATE (cr=4 pr=0 pw=0 time=91 us)'
STAT #47327115779400 id=2 cnt=100 pid=1 pos=1 obj=17867 op='TABLE ACCESS STORAGE FULL LUNAR (cr=4 pr=0 pw=0 time=138 us cost=3 size=0 card=100)'
WAIT #47327115779400: nam='SQL*Net message from client' ela= 323 driver id=1650815232 #bytes=1 p3=0 obj#=-1 tim=1394896509807410
FETCH #47327115779400:c=0,e=4,p=0,cr=0,cu=0,mis=0,r=0,dep=0,og=0,plh=291688323,tim=1394896509807575
WAIT #47327115779400: nam='SQL*Net message to client' ela= 6 driver id=1650815232 #bytes=1 p3=0 obj#=-1 tim=1394896509807623
格式化一下:
SQL ID: dprpmj3h6axvu Plan Hash: 291688323

select count(1)
from
 lunar


call     count       cpu    elapsed       disk      query    current        rows
------- ------  -------- ---------- ---------- ---------- ----------  ----------
Parse        1      0.03       4.39          0          5          0           0
Execute      1      0.00       0.00          0          0          0           0
Fetch        2      0.00       0.00          0          4          0           1
------- ------  -------- ---------- ---------- ---------- ----------  ----------
total        4      0.03       4.39          0          9          0           1

Misses in library cache during parse: 1
Optimizer mode: ALL_ROWS
Parsing user id: 37
Number of plan statistics captured: 1

Rows (1st) Rows (avg) Rows (max)  Row Source Operation
---------- ---------- ----------  ---------------------------------------------------
         1          1          1  SORT AGGREGATE (cr=4 pr=0 pw=0 time=91 us)
       100        100        100   TABLE ACCESS STORAGE FULL LUNAR (cr=4 pr=0 pw=0 time=138 us cost=3 size=0 card=100)


Elapsed times include waiting on following events:
  Event waited on                             Times   Max. Wait  Total Waited
  ----------------------------------------   Waited  ----------  ------------
  SQL*Net message from client                     2      126.89        126.89
  Disk file operations I/O                        1        0.00          0.00
  SQL*Net message to client                       2        0.00          0.00
顺便解释一下,之所以之前重复了8次执行kcfis那些函数,还包括了动态采样,O(∩_∩)O哈哈~:
********************************************************************************

SQL ID: 08vx76v2xp6jp Plan Hash: 291688323

SELECT /* OPT_DYN_SAMP */ /*+ ALL_ROWS IGNORE_WHERE_CLAUSE
  NO_PARALLEL(SAMPLESUB) opt_param('parallel_execution_enabled', 'false')
  NO_PARALLEL_INDEX(SAMPLESUB) NO_SQL_TUNE */ NVL(SUM(C1),:"SYS_B_0"),
  NVL(SUM(C2),:"SYS_B_1")
FROM
 (SELECT /*+ NO_PARALLEL("LUNAR") FULL("LUNAR") NO_PARALLEL_INDEX("LUNAR") */
  :"SYS_B_2" AS C1, :"SYS_B_3" AS C2 FROM "LUNAR"."LUNAR" "LUNAR") SAMPLESUB


call     count       cpu    elapsed       disk      query    current        rows
------- ------  -------- ---------- ---------- ---------- ----------  ----------
Parse        1      0.00       0.30          0          0          0           0
Execute      1      0.01       0.95          0          0          0           0
Fetch        1      0.00       0.21          0          4          0           1
------- ------  -------- ---------- ---------- ---------- ----------  ----------
total        3      0.01       1.46          0          4          0           1

Misses in library cache during parse: 1
Misses in library cache during execute: 1
Optimizer mode: ALL_ROWS
Parsing user id: 37     (recursive depth: 1)
Number of plan statistics captured: 1

Rows (1st) Rows (avg) Rows (max)  Row Source Operation
---------- ---------- ----------  ---------------------------------------------------
         1          1          1  SORT AGGREGATE (cr=4 pr=0 pw=0 time=211740 us)
       100        100        100   TABLE ACCESS STORAGE FULL LUNAR (cr=4 pr=0 pw=0 time=9494 us cost=3 size=0 card=409)

********************************************************************************
未完,待续……