11.2 ASM磁盘和磁盘组的限制如下:
Oracle ASM has the following limits on the number of disk groups, disks, and files:
- 63 disk groups in a storage system
- 10,000 Oracle ASM disks in a storage system
- 1 million files for each disk group
Without any Oracle Exadata Storage, Oracle ASM has these storage limits:
- 2 terabytes (TB) maximum storage for each Oracle ASM disk
- 20 petabytes (PB) maximum for the storage system
With all Oracle Exadata Storage, Oracle ASM has these storage limits:
- 4 PB maximum storage for each Oracle ASM disk(这个有人测试过么?迄今为止所有版本的Exadata上都没有使用超过2T的盘……大盘也是划成小盘的……)
- 40 exabytes (EB) maximum for the storage system
The maximum size limit of a disk group equals the maximum disk size multiplied by the maximum number of disks in a disk group (10,000).
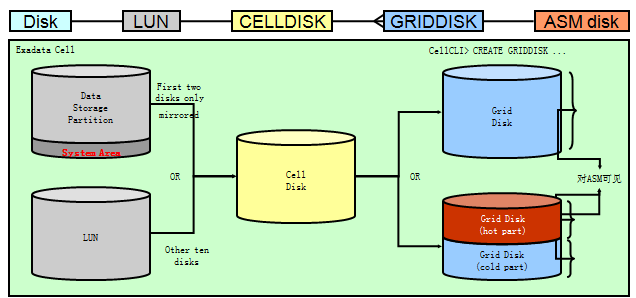
The maximum number of disks across all disk groups is 10,000. The 10,000 disks can be in one disk group or distributed across a maximum of 63 disk groups. This is a limitation on the number of Oracle ASM disks, not necessarily the number of spindles. A storage array could group multiple spindles into a LUN that is used as a single Oracle ASM disk. However Oracle ASM is currently limited to 2 TB in a single disk unless using Oracle Exadata storage.
File size limits are dependent on the value of the disk group compatibility attributes. Oracle ASM supports file sizes greater than 128 TB in any redundancy mode when the COMPATIBLE.RDBMS disk group attribute is set greater than10.1.
If COMPATIBLE.RDBMS is set to 10.1, the file size limits are less. For example, with COMPATIBLE.RDBMS equal to 10.1 and the AU size equal to 1 MB, Oracle ASM file size limits are:
- External redundancy: 16 TB
- Normal redundancy: 5.8 TB
- High redundancy: 3.9 TB
Note:
Oracle Database supports data file sizes up to 128 TB depending on the file system. In addition, Oracle Database has a file size limit that is dependent on the DB_BLOCK_SIZE initialization parameter.
12.1 ASM的磁盘和磁盘组的限制如下:
Oracle ASM has the following limits on the number of disk groups, disks, and files:
511 disk groups in a storage system
10,000 Oracle ASM disks in a storage system
1 million files for each disk group
Without any Oracle Exadata Storage, Oracle ASM has the following storage limits if the COMPATIBLE.ASM disk group attribute is set to less than 12.1:
2 terabytes (TB) maximum storage for each Oracle ASM disk
20 petabytes (PB) maximum for the storage system
Without any Oracle Exadata Storage, Oracle ASM has the following storage limits if the COMPATIBLE.ASM disk group attribute is set to 12.1 or greater:
4 PB maximum storage for each Oracle ASM disk with the allocation unit (AU) size equal to 1 MB
8 PB maximum storage for each Oracle ASM disk with the AU size equal to 2 MB
16 PB maximum storage for each Oracle ASM disk with the AU size equal to 4 MB
32 PB maximum storage for each Oracle ASM disk with the AU size equal to 8 MB
320 exabytes (EB) maximum for the storage system
With all Oracle Exadata Storage, Oracle ASM has the following storage limits:
4 PB maximum storage for each Oracle ASM disk with the AU size equal to 1 MB
8 PB maximum storage for each Oracle ASM disk with the AU size equal to 2 MB
16 PB maximum storage for each Oracle ASM disk with the AU size equal to 4 MB
32 PB maximum storage for each Oracle ASM disk with the AU size equal to 8 MB
320 EB maximum for the storage system
The maximum size limit of a disk group equals the maximum disk size multiplied by the maximum number of disks in a disk group (10,000).
The maximum number of disks across all disk groups is 10,000. The 10,000 disks can be in one disk group or distributed across a maximum of 511 disk groups. This is a limitation on the number of Oracle ASM disks, not necessarily the number of spindles. A storage array could group multiple spindles into a LUN that is used as a single Oracle ASM disk.
File size limits are dependent on the value of the disk group compatibility attributes. Oracle ASM supports file sizes greater than 128 TB in any redundancy mode when the COMPATIBLE.RDBMS disk group attribute is set greater than10.1.
If COMPATIBLE.RDBMS is set to 10.1, the file size limits are less. For example, with COMPATIBLE.RDBMS equal to 10.1 and the AU size equal to 1 MB, Oracle ASM file size limits are:
External redundancy: 16 TB
Normal redundancy: 5.8 TB
High redundancy: 3.9 TB
Note:
Oracle Database supports data file sizes up to 128 TB depending on the file system. In addition, Oracle Database has a file size limit that is dependent on the DB_BLOCK_SIZE initialization parameter.
For information abo
根据12.1的官方文档,ASM 存储的限制更加宽松了,但是众所周知的Bug 6453944导致实际上 单盘>=2T 就会报“ORA-15196 WITH ASM DISKS LARGER THAN 2T”,而AIX 单盘4P的bug依然没有彻底解决:
这里需要注意的问题:
(1)aix上单盘为4P的bug: On release 11.2.0.1: This problem is due to the Bug 9495887 ASM RECOGNIZE 1.25 TB DISKS AS 4,095.25 TB DISKS ON AIX.(类似的其他bug还有几个,有兴趣的可以MOS上搜索)
(2)11.1和11.2上,”单盘>=2T”的bug是由于ASM的硬编码造成的,类似的例如:11.1上的Bug 13852568 : ADD ASM INDIVIDUAL DISK SPACE METRIC, 11.2上的Bug 6453944 : ORA-15196 WITH ASM DISKS LARGER THAN 2TB等等(根据bug描述,言外之意是,如果fixed了,可以使用2T单盘……仅此而已)
(3)在“IOE”架构中,我们通常建议单盘500G~1T(在部分环境下1.5T也有bug),但是在目前流行的各家一体机上,恐怕使用小于2T的盘是一个 不可绕开的问题了……没有环境,否则可以测试下最新的11.2.0.4.x和12.1.0.1.2,是否可以突破2T的限制……
Anyway,bug是不可缺少的磨练,毕竟ASM单盘超过2T或者4T等等是一个未来的趋势(希捷老大前段时间不是说明年要出10T的机械盘么……),但是迄今为止,使用超过2T做单盘的ASM确实比例少之又少……O(∩_∩)O哈哈~